|
MGS-TES Special Products
- TES Bolometric Albedo Map
MGS-TES visible/near-IR data (0.3 to 2.9 micrometers) have been reduced to Lambert albedo values, gridded at 8 pixels/degree, and projected as a simple cylindrical global map.
Reference: Christensen et al. (2001), Mars Global Surveyor Thermal Emission Spectrometer experiment: Investigation description and surface science results, Journal of Geophysical Research, 106, pp. 23,823 - 23,872.
Download: global_albedo_8ppd.img (15800 KB) global_albedo_8ppd.lbl (3 KB)
- TES Emissivity Spectral Shapes
The canonical TES spectral endmembers, including atmospheric, basaltic, hematite, and andesitic emissivity spectral shapes, are available in the ascii file. Spectral values are given for TES samples 9-35 and 65-100. For more information, see Bandfield, 2003.
Reference: Bandfield et al. (2000), A global view of Martian surface compositions from MGS-TES, Science, 287,1626-1630.
and Bandfield et al. (2000), Spectral dataset factor analysis and endmenber recovery: Application to Martian atmospheric particulates, Journal of Geophysical Research, 105,9573-9588.
Download: TES_emissivity_spectral_shapes.ascii (8 KB)
- TES EPF Derived Spectral Shapes
MGS-TES emission phase function (EPF) observations were used to derive high and low albedo surface emissivities, as well as the spectral response of atmospheric dust. Standard deviations for each spectra are included in the data file. For more information, see Bandfield, 2003.
Reference: Bandfield and Smith (2003), Multiple emission angle surface-atmosphere separations of Thermal Emission Spectrometer data, Icarus, 161, 47-65.
Download: epf_derived_averages.ascii (13 KB)
- TES Mineral Maps
Global mineral abundance maps were derived using atmospherically corrected TES spectral data and a suite of 36 endmembers. All mineral maps are projected in simple cylindrical format at several spatial resolutions. The 13 mineral and error components listed below are stored in the third dimension of the ISIS and ENVI files. The single component TIF files are overlain on MOLA shaded relief topography, and interpolated between data tracks for improved appearance. For more information, see Bandfield, 2003.
Reference: Bandfield (2002), Global mineral distributions on Mars, Journal of Geophysical Research, 10.1029/2001JE001510.
Download:
- TES Surface Emissivity
Global surface emissivity maps, in simple cylindrical projection, are available at several resolutions. TES spectral values for 9-35 and 65-100 are stored as the 73 bands (third dimension) of the ISIS and ENVI files. For more information, see Bandfield, 2003.
Reference: Bandfield (2002), Global mineral distributions on Mars, Journal of Geophysical Research, 10.1029/2001JE001510.
Download:
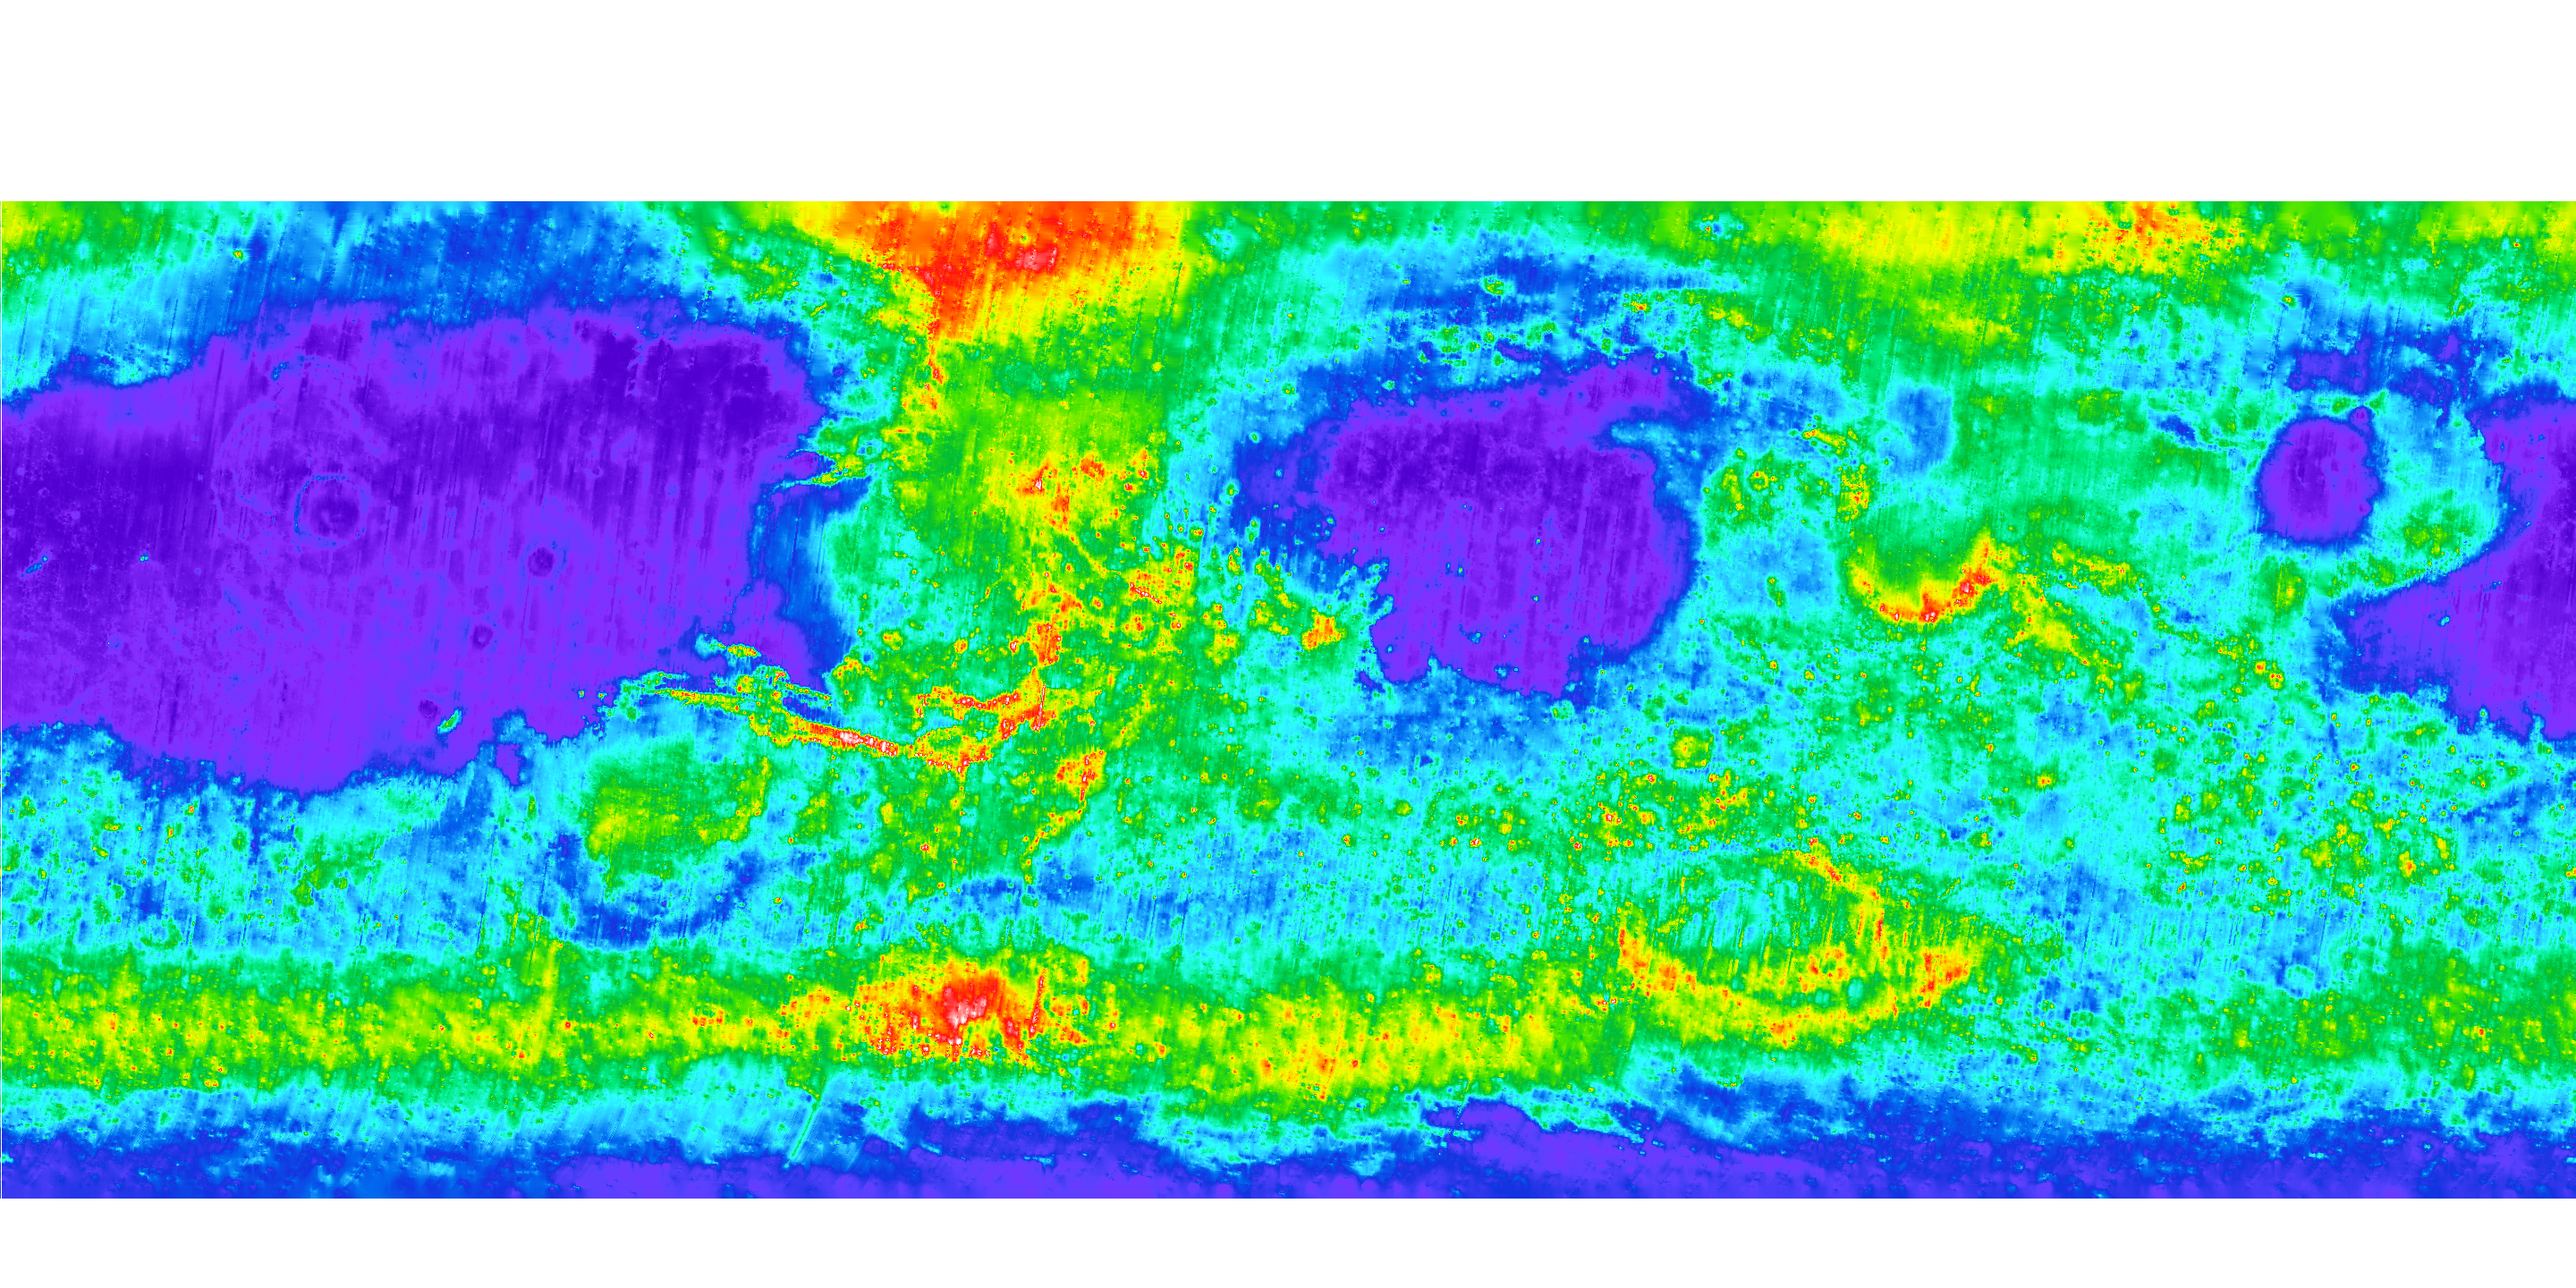
- TES Thermal Inertia Map
The Christensen TES thermal inertia map is derived from TES thermal bolometer data collected during 1997 - 2003 and manually selected to minimize the effects of atmospheric dust and clouds. This map shows thermal inertia values between 60 degrees south and 60 degrees north at 8 pixels/degree resolution, and are provided in Vicar and PNG file formats. An interactive version of this map can be found here.
Reference: Christensen et al. (2001), The MGS-TES experiment: Investigation description and surface science results, Journal of Geophysical Res., 106, 23,823-23,871.
Download: Christensen Thermal Inertia Map vicar (16 MB) png (3 MB)
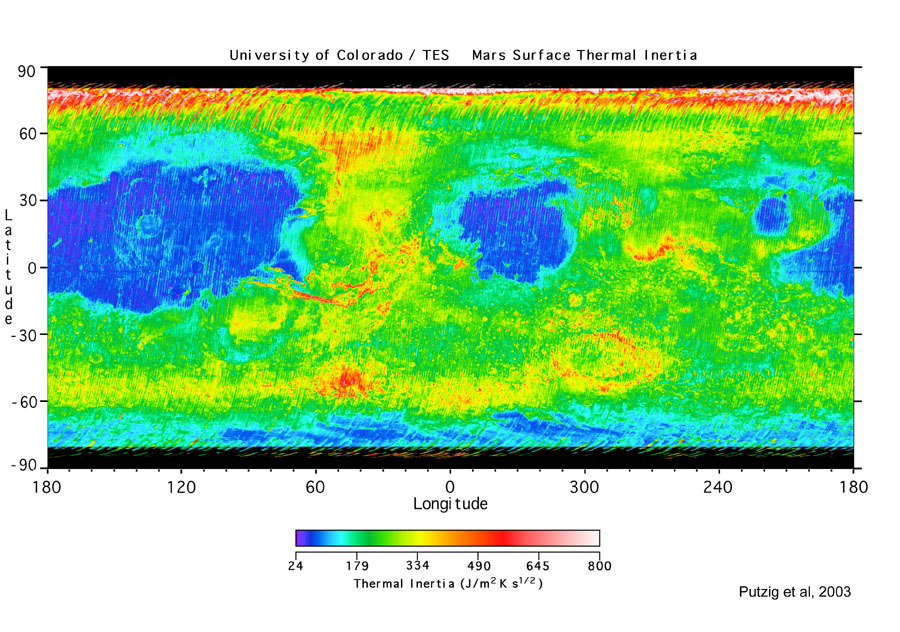
The Putzig TES thermal inertia map is derived from TES thermal bolometer and nighttime temperature data collected during TES ock 1583-11254 (Feb 1999 - April 2001). This map shows values between 80 degrees south and 80 degrees north at 20 pixels/degree resolution, and is provided in binary and JPEG file formats. For more information on these products, see here.
Reference: Putzig et al. (2005), Global thermal inertia and surface properties of Mars from the MGS mapping mission, Icarus, 173, 325-341.
Download: Thermal Inertia Map binary (50000 KB) Small JPG (257 KB)
File format descriptions
ASCII files (*.ascii) are stream text files with a line feed character (ASCII 10) at the end of each record. For ascii table files, line 1 contains a label for each field.
ENVI files (*.envi) are uncompressed, binary, band-sequential qube of 16-bit integer data described in the associated ENVI header (*.envi.hdr) ASCII text file. These files are intended to be opened with the ENVI image processing software.
Image files (*.img) are binary arrays of 32-bit floating-point pixels. Each data file is accompanied by a PDS label (*.lbl), an ASCII text file that describes the format of the image. The images use a simple cylindrical map projection, described in the file dsmap.cat. These images may be viewed using the display software NASAView.
ISIS files (*.isis) are composed of a simple ASCII label attached to an uncompressed, binary, band-sequential qube of 16-bit integer data. The files are produced using standard tools in the ISIS software package.
JPEG, PNG, and TIF files (*.jpg, *.png & *.tif) are color images that can be manipulated by a wide variety of standard imaging programs.
|


